
Pollution Impact Potential (PIP) Maps
Pollution Impact Potential (PIP) maps for Nitrogen (N) and Phosphorus (P) help identify areas at highest risk of nutrient losses from farmland to rivers, lakes, and groundwater. These maps support local catchment assessments and help target actions that protect water quality.
PIP maps act as signposts for where further characterisation and engagement actions should be prioritised. They can be used by different audiences with varying requirements, including at national level, such as supporting policy development and planning; at local level, for catchment assessments to target water quality actions; and at farm level, to support decision-making by farmers and advisers.
PIP maps show relative risk rather than exact measurements and should be used as a guide for planning and decision-making. They are designed for use at a water body scale (up to 1:25,000) and should not be used to make decisions at an individual field level. Local knowledge and on-the-ground checks are always required.
National problems, local solutions
Jenny Deakin from the EPA Catchments Unit introduced PIP maps at a Teagasc Signpost Seminar, using the Blackwater catchment as a case study to show how local actions can address national water quality challenges.
Why are PIP Maps useful?
Nutrients like nitrogen and phosphorus behave differently in the landscape:
- Phosphorus risk is higher in areas with poorly draining soils and surface runoff.
- Nitrogen risk is higher in areas with freely draining soils and groundwater pathways.
Understanding these risks helps target measures where they will have the greatest impact.
How do PIP Maps work?
PIP maps estimate potential nutrient losses from agricultural land using data on:
- Farm management e.g. livestock and crops
- Soil type and drainage
- Hydrogeology and flow pathways
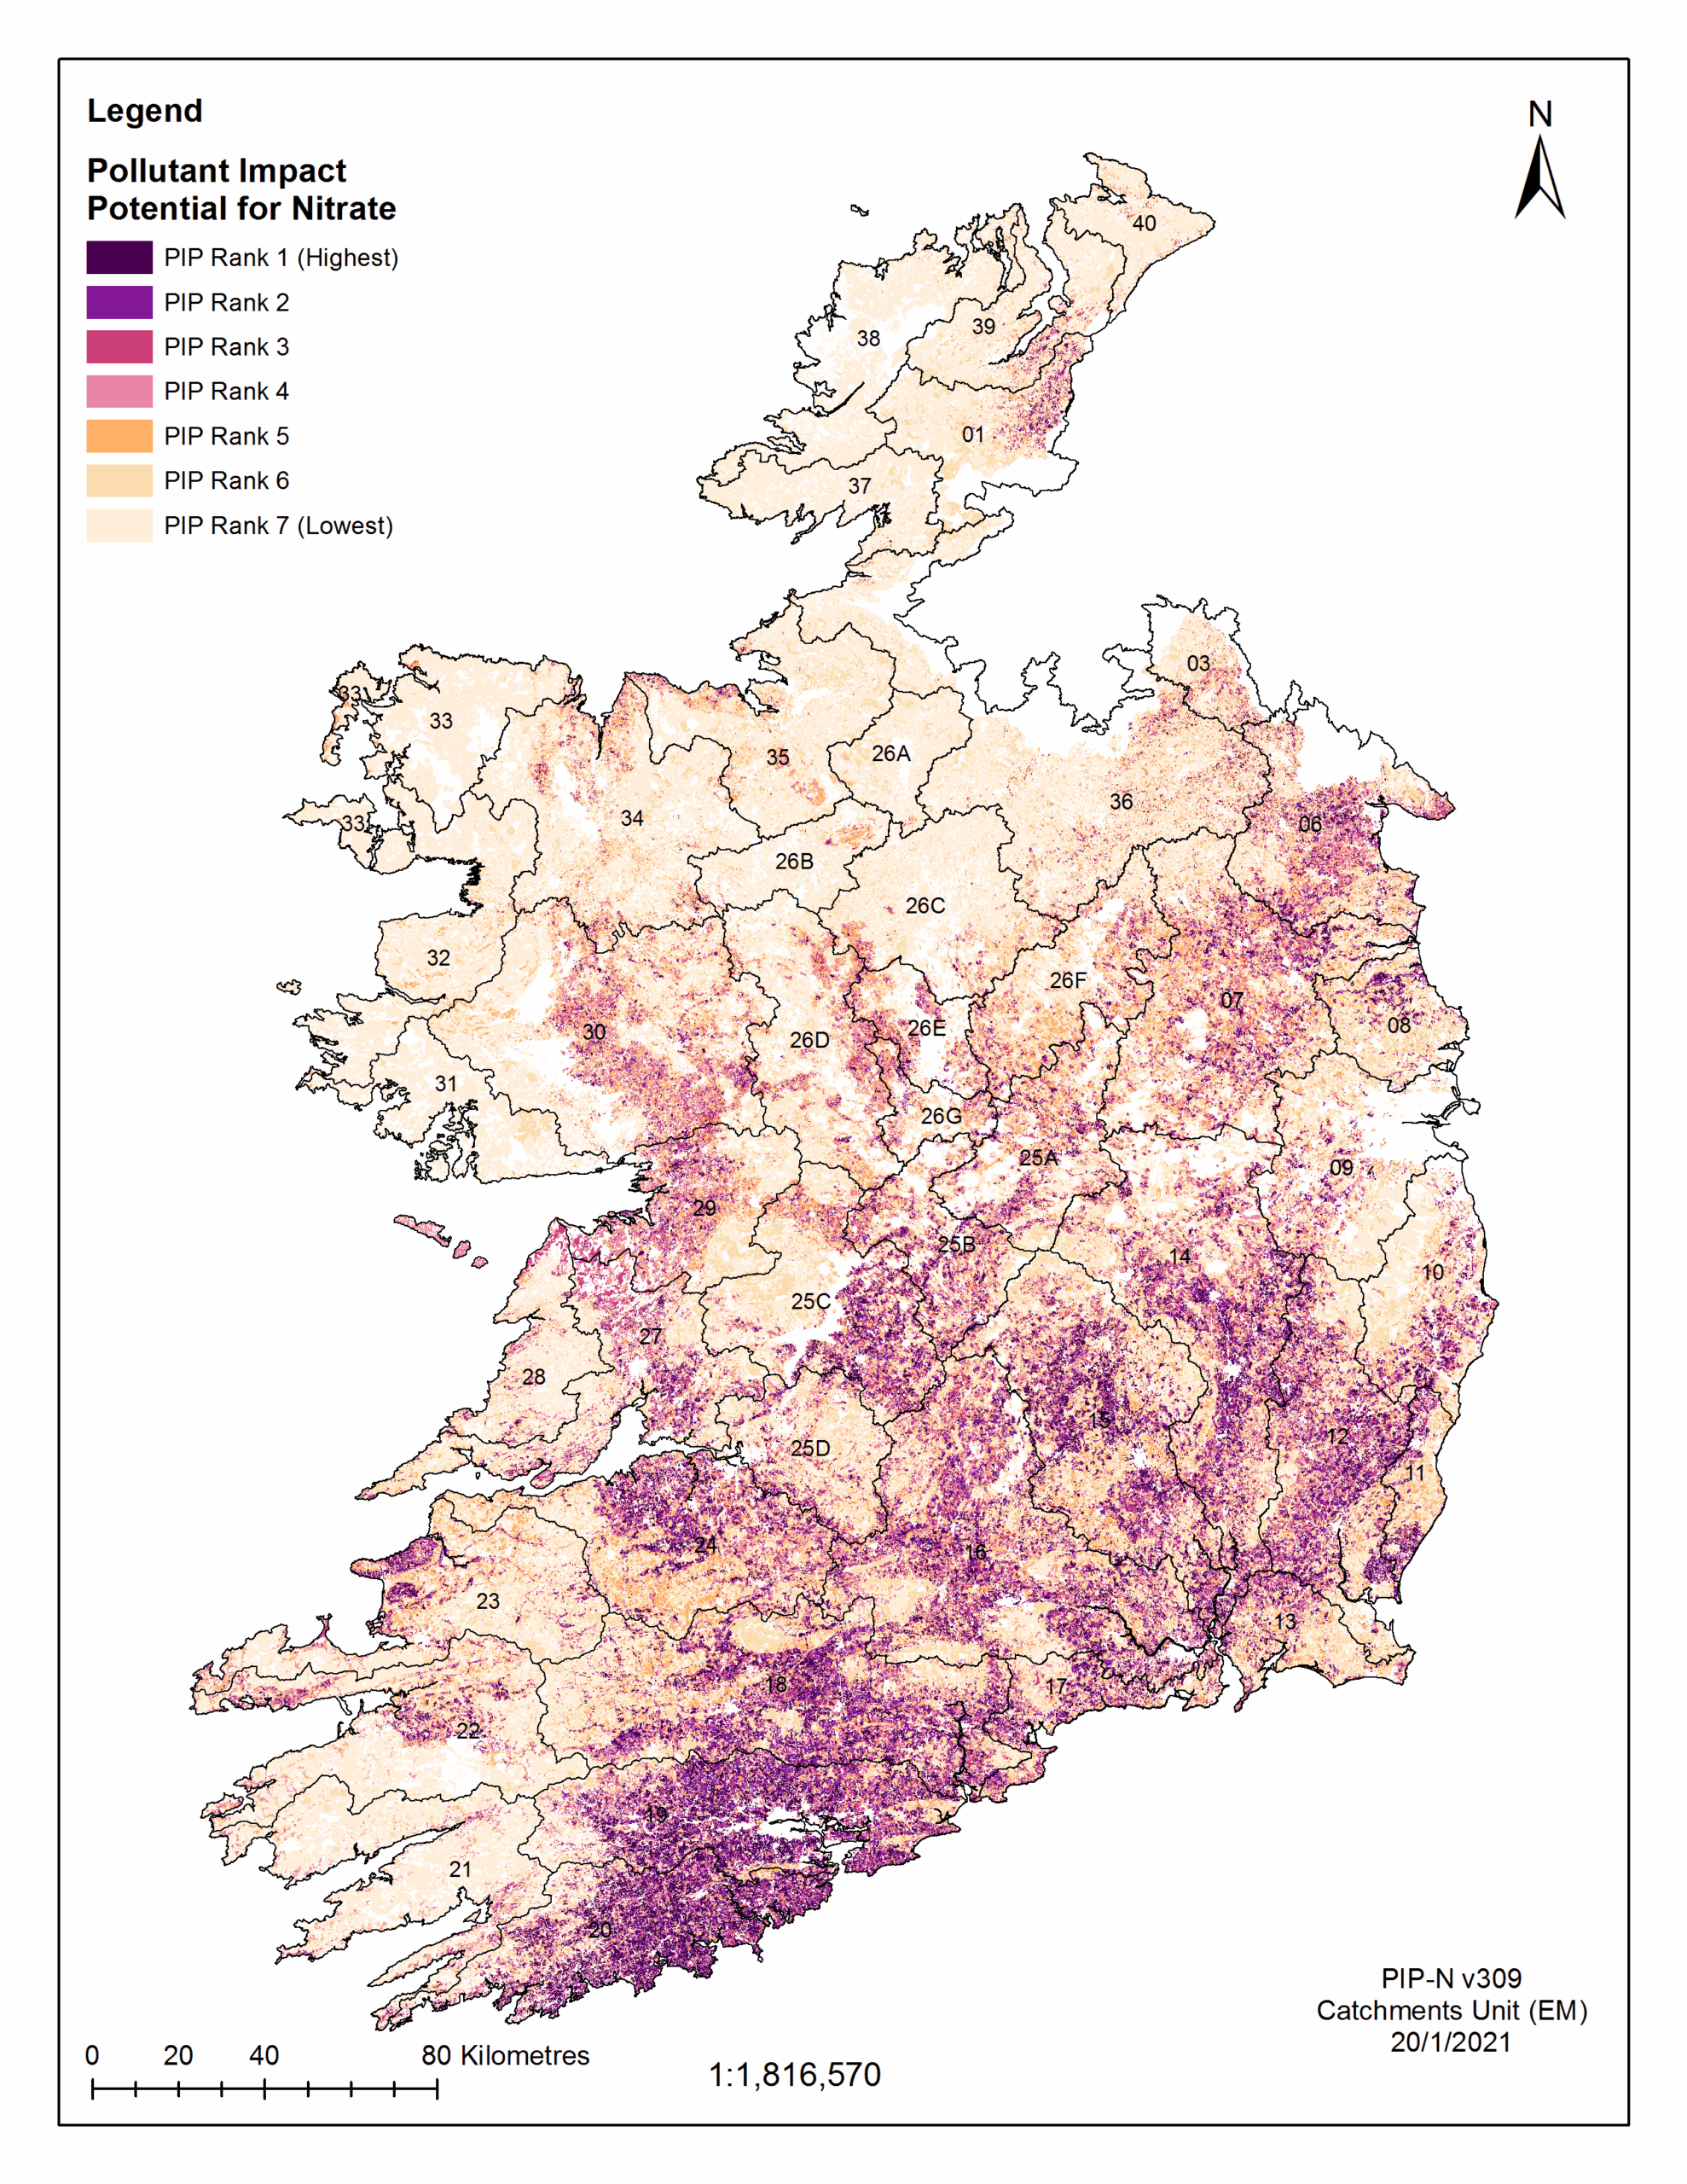
The maps rank areas from High PIP (higher potential impact) to lower risk. High PIP areas (ranked 1, 2 or 3) are signposts for further investigation and action.
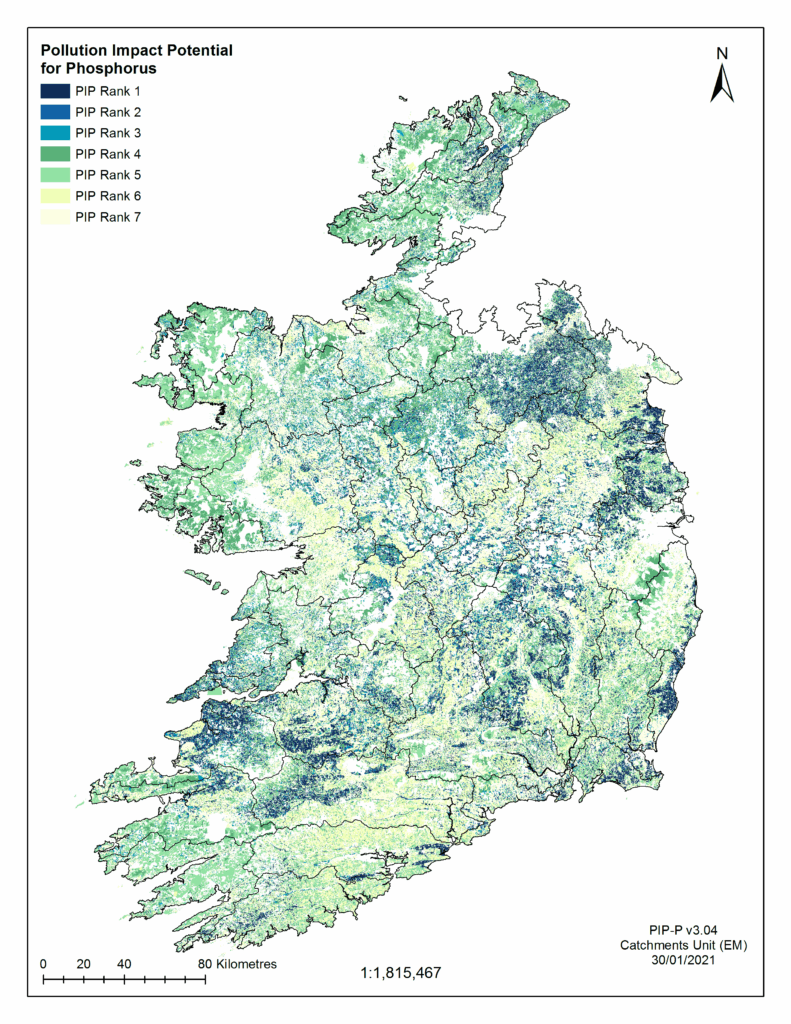
Types of PIP maps
PIP-N (Nitrate)
Highlights high risk areas for nitrate losses to water. These are often freely draining soils with moderate to high livestock intensity.
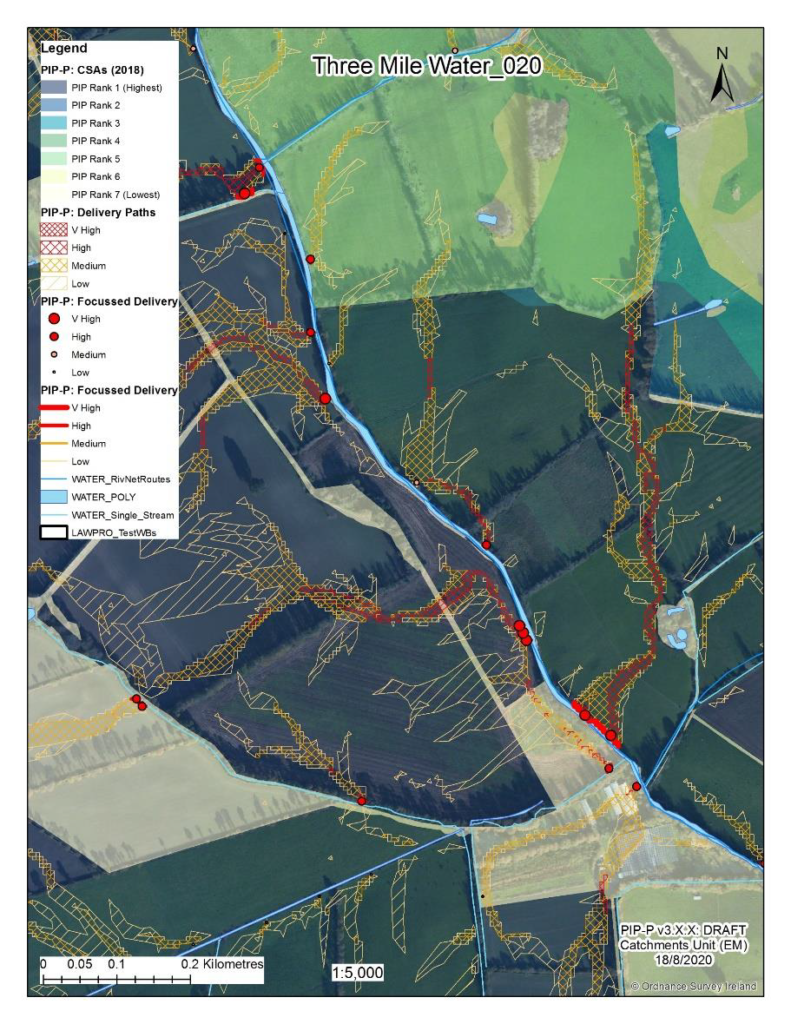
PIP-P (Phosphorus)
PIP-P (Phosphorus) maps combine three layers:
- Critical Source Areas (CSA): Where phosphorus sources and risk factors overlap.
- Focussed Delivery Flow Paths: Routes where runoff accumulates.
- Flow Points: Where focused deliver flow path enters watercourses.
How to use PIP maps
Watch this short video to learn how to access and interpret Pollution Impact Potential (PIP) maps.
The video shows:
- How to find your location on the map
- What the different layers mean
- How to identify areas with higher nutrient loss risk
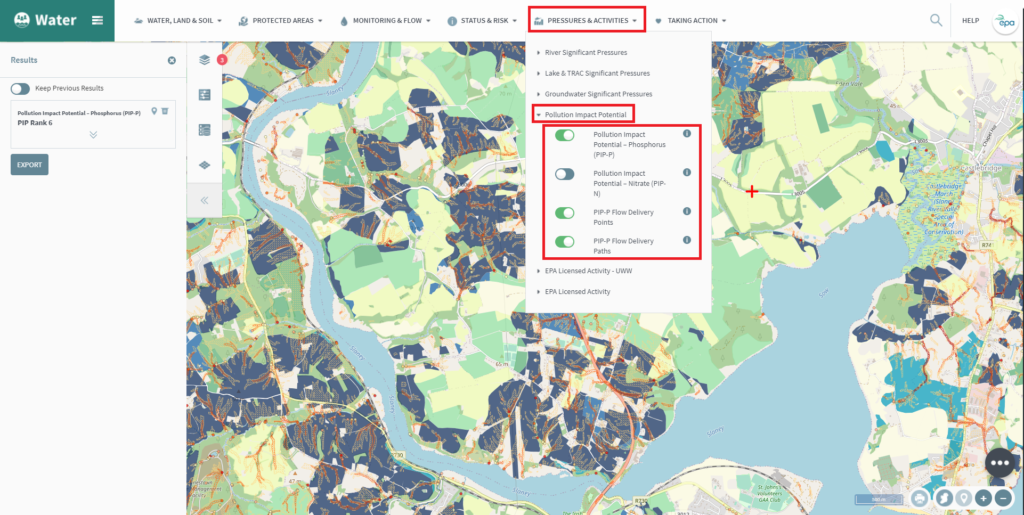
Viewing PIP Maps
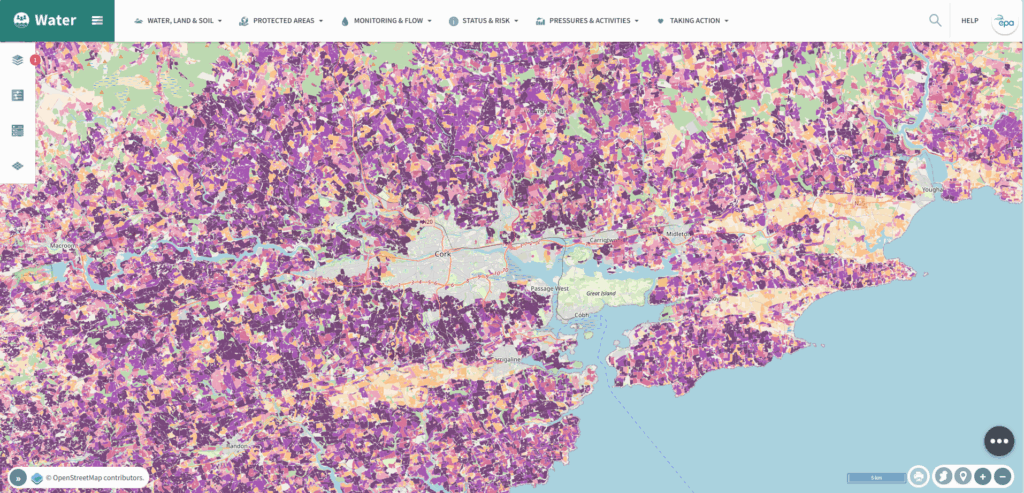
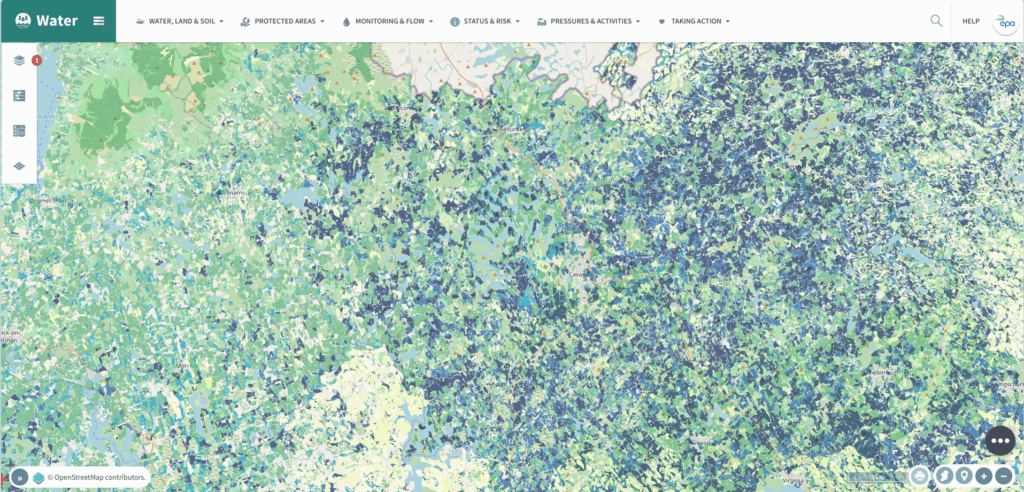
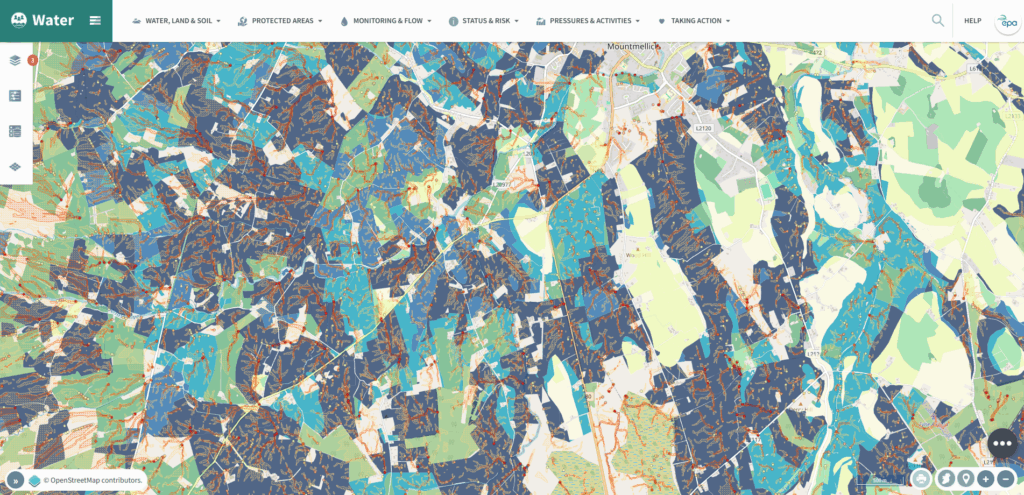
PIP maps are available to view on the EPA Water Maps
Please note: these layers are very large and may take some time to load in your browser. For best results, use Chrome or Edge. If you are encountering issues, clearing your cookies and cache on your browser may help.
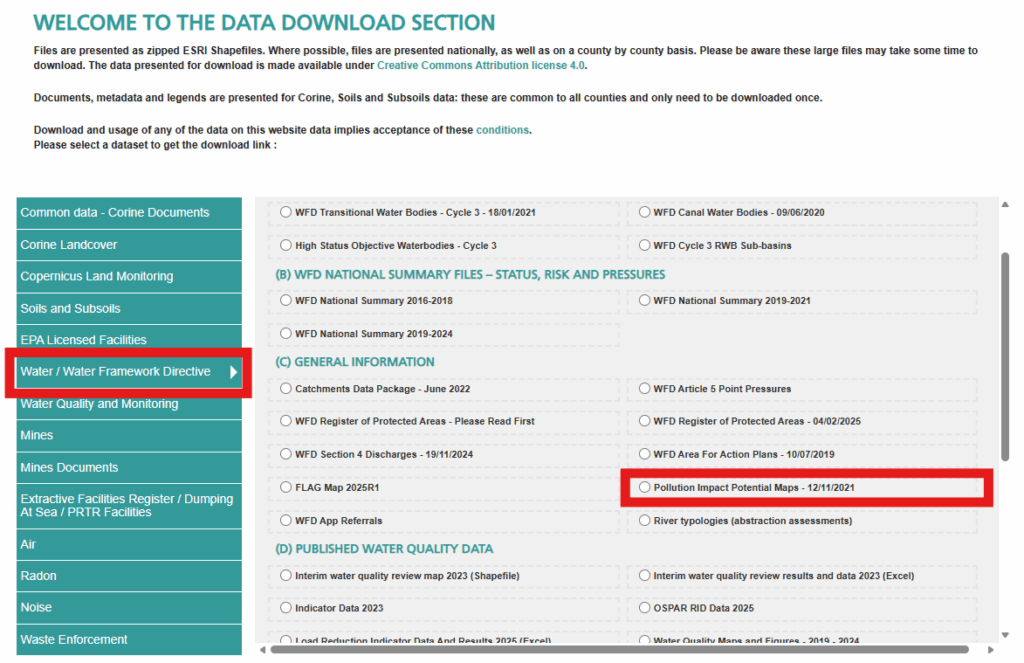
Download the PIP Maps
You can download the PIP maps from the EPA’s Data Portal
Important notes
- PIP maps are not a compliance tool and should not be used alone for farm-level decisions.
- PIP maps help prioritise areas for local catchment walks and engagement.
- Always combine map insights with local evidence.
Technical Overview: Pollution Impact Potential (PIP) Maps
Want to dive deeper into the science behind nutrient risk mapping? Explore our detailed guide on Pollution Impact Potential (PIP) maps for nitrogen and phosphorus. Learn how these maps are created, what data they use, and how they help target actions to protect water quality.
Who is involved?
Quite simply, everyone in Ireland has a role to play. This can be from something as simple as making sure you don’t pollute your local stream, or a local community working together to establish a Rivers Trust to enhance the rivers and lakes in their area, to a Government Department or Agency helping a Minister implement a new policy to help protect and enhance all our water bodies.
This website has been developed and is maintained by the Environmental Protection Agency, and is a collaboration between the Department of Housing, Planning and Local Government, the Environmental Protection Agency, and the Local Authority Waters Programme.
Local Authority Waters Programme
The Local Authority Waters Programme coordinates the efforts of local authorities and other public bodies in the implementation of the River Basin Management Plan, and supports local community and stakeholder involvement in managing our natural waters, for everyone’s benefit.

Environmental Protection Agency
The EPA is responsible for coordinating the monitoring, assessment and reporting on the status of our 4,842 water bodies, looking at trends and changes, determining which waterbodies are at risk and what could be causing this, and drafting environmental objectives for each.

Department of Housing, Local Government and Heritage
The Department is responsible for making sure that the right policies, regulations and resources are in place to implement the Water Framework Directive, and developing a River Basin Management Plan and Programme of Measures to protect and restore our waters.