
WFD Data and Dashboards
Data pages for all waterbodies and WFD Dashboards are available on catchments.ie to show you information about water quality as assessed under the Water Framework Directive.
You can also view information on the EPA Water Map.
Data Pages
The catchments.ie data pages have information on:
- Catchments – for each of our 46 catchments you can read a Catchment Assessment, view them on the EPA Water Map and see all the subcatchments in each catchment.
- Subcatchments – these pages show 2nd Cycle Subcatchment Assessments (completed in 2018) and the waterbodies that are in each subcatchment.
- Waterbodies – the waterbody pages show data for each waterbody, including WFD Status, WFD Risk, upstream and downstream waterbodies, trends and charts, and downloadable WFD chemistry monitoring data (where available), and allow you to view them on the EPA Water Map.
WFD Dashboards
WFD Overview Dashboard
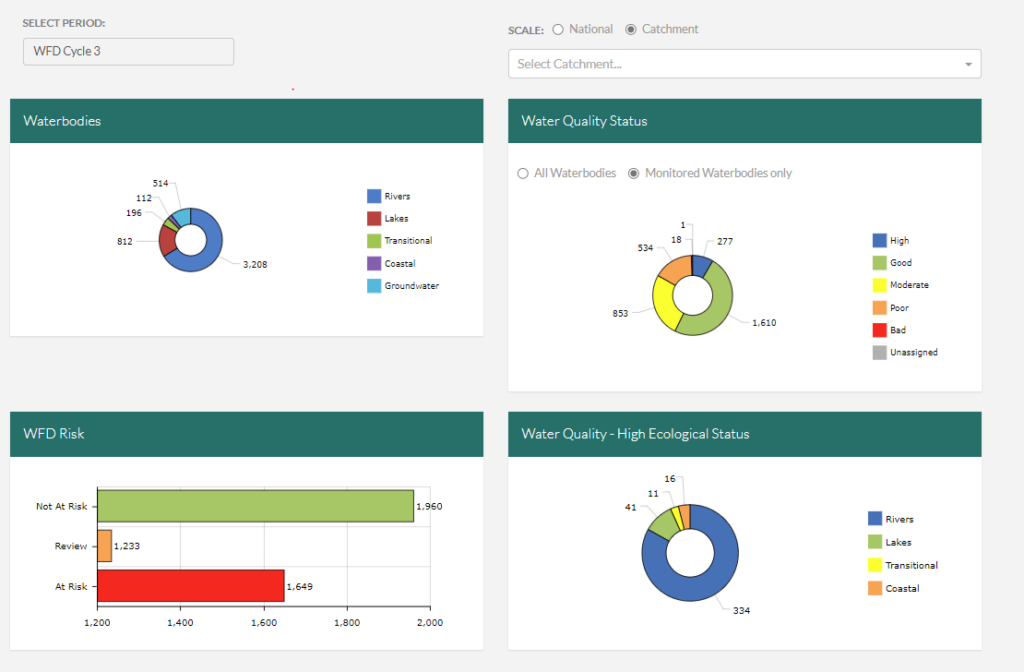
You can see a national overview or select any of the 46 catchments in Ireland.
Information is available for two time periods:
- WFD Cycle 3, which is the most up-to-date information and is largely based on 2016-2021 WFD Monitoring Data, or
- WFD Cycle 2
Water Quality Status Dashboard
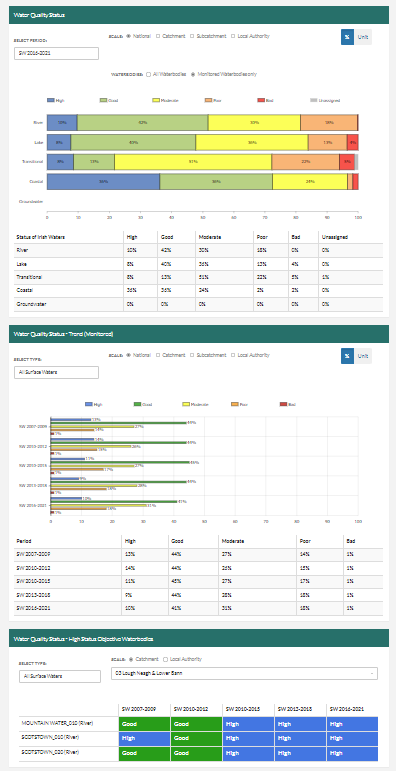
You can view the following information for National, Catchment, Subcatchment or Local Authority areas:
- Water Quality Status for all waterbodies, or monitored waterbodies only
- Water Quality Status Trends in monitored waterbodies
You can view the following for any Catchment or Local Authority area:
- Water Quality Status for High Status Objective Waterbodies
You can select different Monitoring Periods using the drop down menu for Surface Waters (SW) – this also allows you to select Groundwaters (GW) to view dashboards for these.
The monitoring periods are:
- SW 2016-2021
- SW 2013-2018
- SW 2010-2015
- SW 2010-2012
- SW 2007-2009
- GW 2016-2021
- GW 2013-2018
- GW 2010-2015
- GW 2010-2012
- GW 2007-2009
WFD Risk
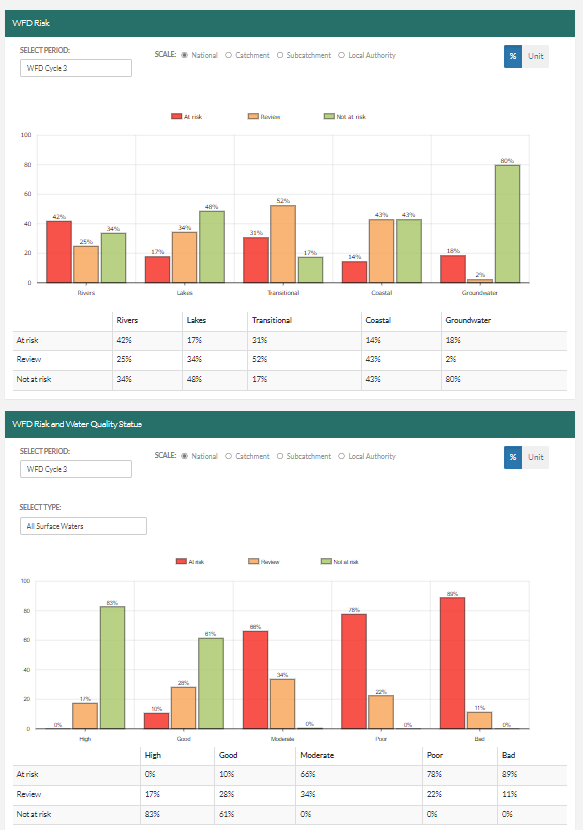
You can view the following information for National, Catchment, Subcatchment or Local Authority areas:
- WFD Risk: this dashboard shows WFD Risk broken down by waterbody type – Rivers, Lakes, Transitional, Coastal, Groundwater
- WFD Risk and Water Quality status: this dashboard show s the breakdown of WFD Risk by WFD Status – High, Good, Moderate, Poor and Bad.
You can also filter this dashboard using ‘Select Type’ to see a dashboard for River, Lake, Transitional, Coastal or Groundwater only.
Information is available for two time periods:
- WFD Cycle 3, which is the most up-to-date information and is largely based on 2016-2021 WFD Monitoring Data, or
- WFD Cycle 2
WFD Pressures
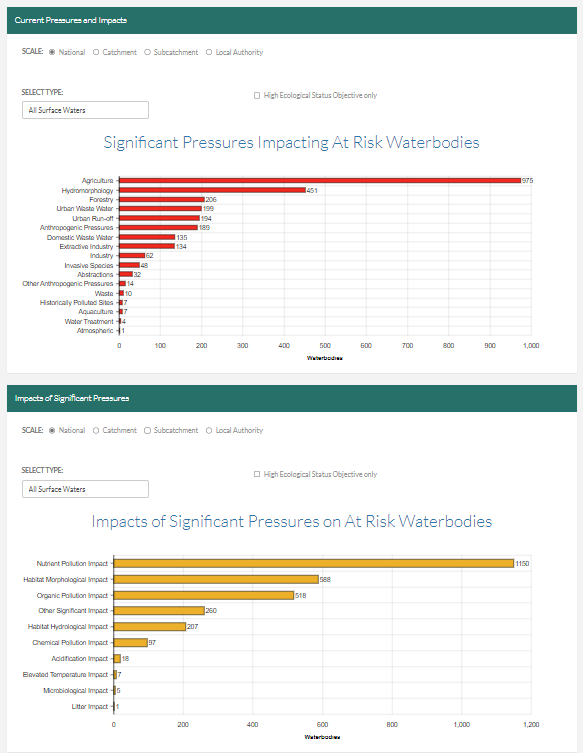
You can view the following information for National, Catchment, Subcatchment or Local Authority areas:
- Significant Pressures Impacting At Risk Waterbodies
- Impacts of Significant Pressures on At Risk Waterbodies
You can also filter this dashboard using ‘Select Type’ to see a dashboard for River, Lake, Transitional, Coastal or Groundwater only.
A checkbox is also included which allows you to filter and see a dashboard for High Ecological Status Objectives Waterbodies only.
This is a live dataset so is updated regularly as pressures are added or removed based on the latest evidence, including Local catchment Assessments by LAWPRO.
WFD Objectives
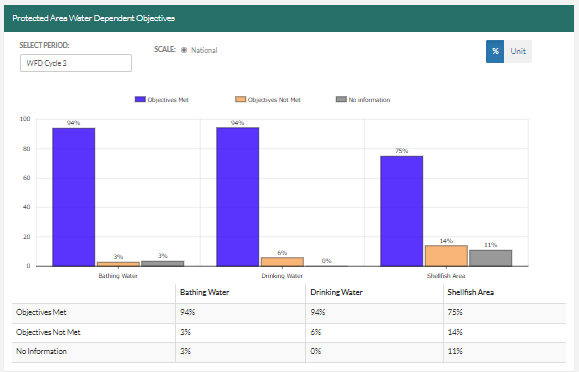
This dashboard is available at National scale.
You can see a dashboard showing if Protected Area Water Dependent Objectives were met for:
- Bathing Waters
- Drinking Waters
- Shellfish Areas
Information is available for two time periods:
- WFD Cycle 3, which is the most up-to-date information and is largely based on 2016-2021 WFD Monitoring Data, or
- WFD Cycle 2
Who is involved?
Quite simply, everyone in Ireland has a role to play. This can be from something as simple as making sure you don’t pollute your local stream, or a local community working together to establish a Rivers Trust to enhance the rivers and lakes in their area, to a Government Department or Agency helping a Minister implement a new policy to help protect and enhance all our water bodies.
This website has been developed and is maintained by the Environmental Protection Agency, and is a collaboration between the Department of Housing, Planning and Local Government, the Environmental Protection Agency, and the Local Authority Waters Programme.
Local Authority Waters Programme
The Local Authority Waters Programme coordinates the efforts of local authorities and other public bodies in the implementation of the River Basin Management Plan, and supports local community and stakeholder involvement in managing our natural waters, for everyone’s benefit.

Environmental Protection Agency
The EPA is responsible for coordinating the monitoring, assessment and reporting on the status of our 4,842 water bodies, looking at trends and changes, determining which waterbodies are at risk and what could be causing this, and drafting environmental objectives for each.

Department of Housing, Local Government and Heritage
The Department is responsible for making sure that the right policies, regulations and resources are in place to implement the Water Framework Directive, and developing a River Basin Management Plan and Programme of Measures to protect and restore our waters.