EPA Water Maps
EPA Water Maps
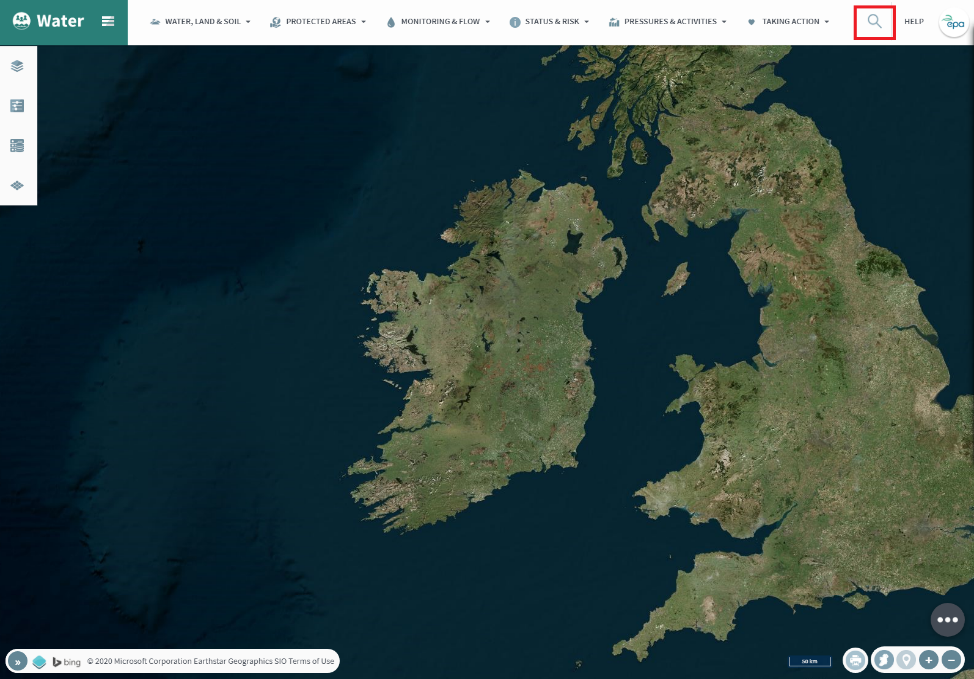
EPA Water Maps provide an interactive way to explore Ireland’s rivers, lakes, estuaries, and coastal waters. Developed by the Environmental Protection Agency (EPA), these maps give you access to the latest available data on water quality and environmental pressures across the country.
The EPA Water Map has a range of layers available, with detailed information on:
- Water, Land and Soil
- Protected Areas
- Monitoring and Flow
- Status & Risk
- Pressures and Activities
- Taking Action
With EPA Water Maps, you can:
- View water quality data and information for your local area or any catchment in Ireland.
- Identify environmental pressures such as nutrient pollution or physical changes to waterbodies.
- Support better decision-making for farming, land management, and community actions that protect water resources.
The EPA Water Map can be found here:
How to Use EPA Water Maps
On this page we have information on:
- YouTube videos on how to use the EPA Water Map, and its Pollution Impact Potential Map layers for Nitrogen and Phosphorus
- Map layers and categories
- How to switch on the satellite images for your map
- Adjusting how your layers look and understanding what they mean
- Some of the tools:
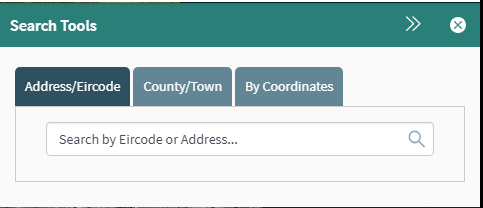
- Search by Eircode, address, county/town or coordinates so you can easily find where you live
- Measurement and drawing tools
- How to print your map
How to use the EPA Water Maps
How to use Pollution Impact Potential Map layers for Nitrogen and Phosphorus
Map layers and categories
Any layer can be switched on by using the menu at the top of the map.
The categories and layers are:
Water, Land and Soil
- Water: includes water features like catchments, subcatchments, river sub-basins and water bodies, along with river flow and river network layers
- Geography: counties, local authority areas and settlements
- Hydrogeology: GSI bedrock and gravel aquifers, GSI Vulnerability
- Soil: Subsoils and susceptibility maps for nitrate and phosphate
Protected Areas
- Drinking Water, Recreational Waters (designated Bathing Waters for swimming), Shellfish, Salmonid, Conservation Areas (SACs, SPAs)
Monitoring and Flow
- Q Values – river ecology monitoring results from 1971 to present
- Flows and Levels – both monitored and modelled, with links to all active hydrometric monitoring gauges
- National Monitoring Stations
Status and Risk
- Bathing Water Quality – this is updated during the bathing season which runs form 1 June to 15 September and includes links to www.beaches.ie, which has information on water quality, tides, accessibility and weather for all designated Bathing Waters
- WFD Risk 3rd Cycle
- WFD Status 2016-2021
- WFD Status 2013-2018
- WFD Risk 2nd Cycle
- WFD 2010-2015
- High Status Objective water bodies
Pressures and Activities
- Significant Pressures for river, lake, transitional and coastal water bodies
- Pollution Impact Potential Maps
- EPA Licensed Activities – Urban Waste Water, waste and Industrial facilities
Taking Action
- Stories – these are all stories from catchments.ie, showing how local communities and public bodies are working to protect and restore water quality in Ireland
- WFD Areas for Action – this shows the Priority Areas for Action that are being focused on by the Local authority Waters Programme. Further details on all Areas for Action are available at www.catchments.ie/data/#/areaforaction
- Catchment Projects: areas where there are already projects ongoing at catchment scale, or where funding or plans are in place, which will have benefits for water quality protection/restoration during WFD Cycle 3. They include community initiatives (like Rivers Trusts), LIFE, EIP, INTERREG and public body research projects.
- Farm and Landscape measures for Agriculture (FLAG): Where agricultural measures are needed to restore water quality, the Subbasin are highlighted with one or more coloured flags to indicate the types of water quality issues associated with that Subbasin.
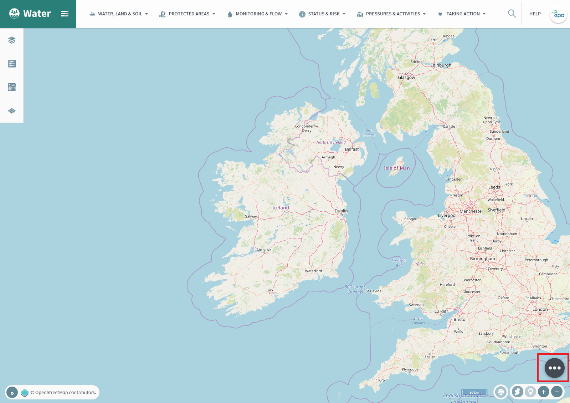
Satellite Images
This means you can see satellite imagery for any area. This baser layer can be accessed by clicking the three dots in the lower right of the map and selecting ‘Bing Maps’.

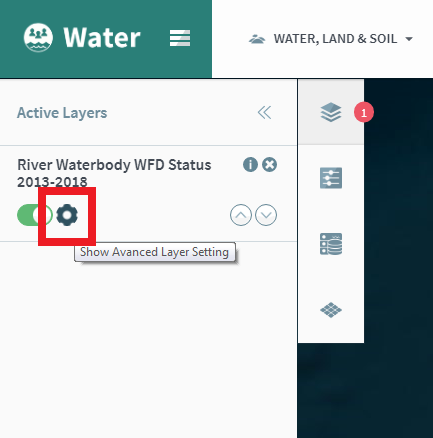
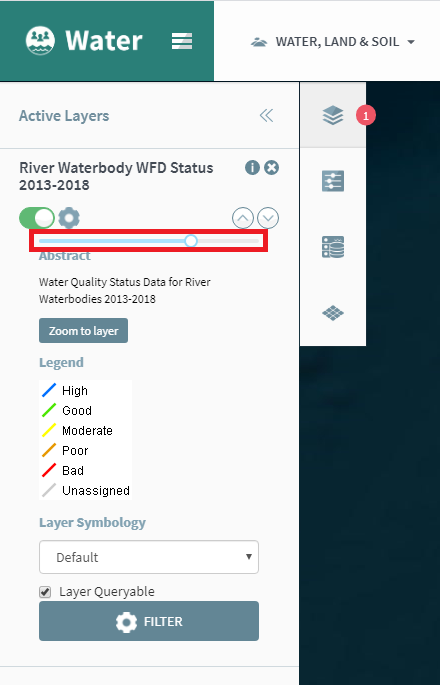
Adjusting how your layers look
Once you switch a layer on, you can change how it looks by clicking the ‘Active Layer’ menu on the left of the map.


New tools for search, measurement and drawing
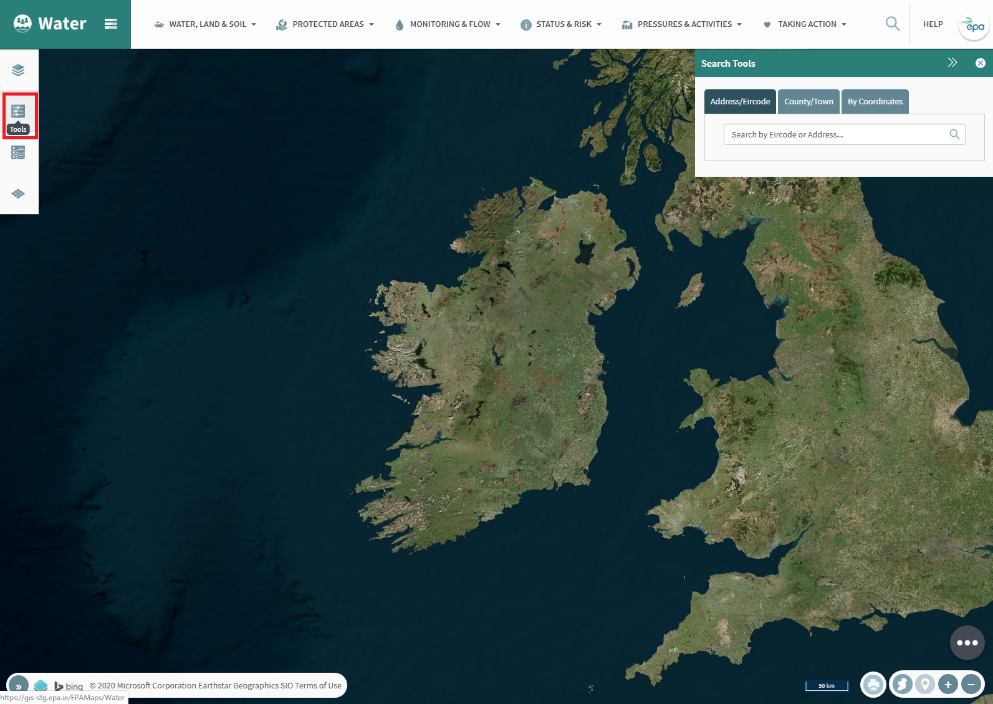
Search tools: You can search by Address, Eircode, County/Town and Coordinates. You can access these by clicking the Magnifying Glass in the top right or by clicking the tools menu on the left of the maps
Tools Menu Overview
Search for water features, measure distances, and draw on your map. The tools menu can be accessed from the left hand side of the map.
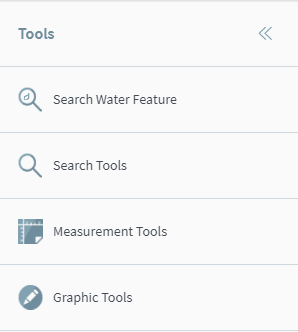
The tools menu includes the following:
- Search Water Feature: you can search for any river, lake, estuary, coastal water, catchment or subcatchment using this
- Search Tools – this is another way to access the Eircode/County/Coordinates search shown above already
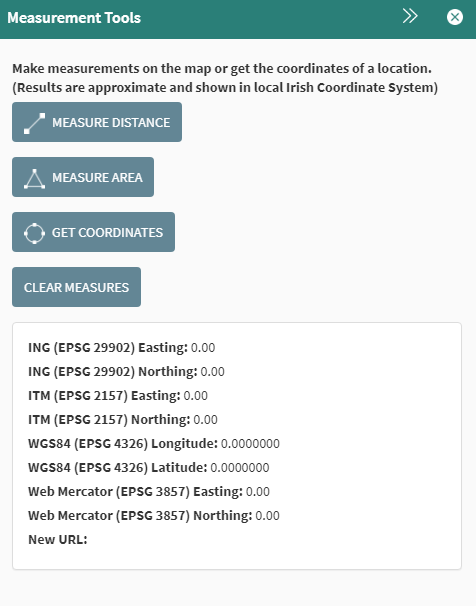
- Measurement Tools
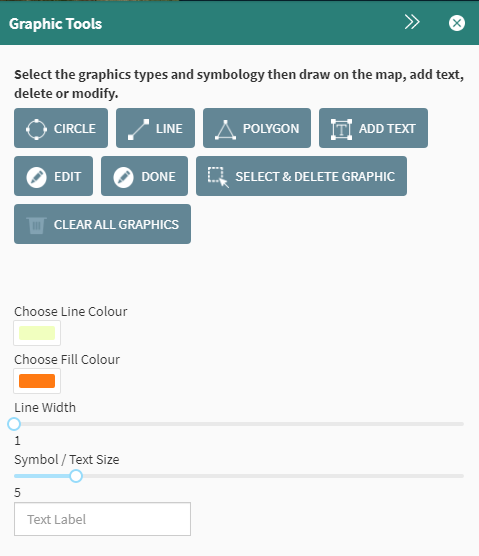
- Graphic Tools -these allow you to draw on the map
Measurement tools
Graphic tools
These tools allow you to draw on the map and to add text. You can also print your map after you have added a drawing or text.
Print Map
This allows you to print the map on screen, along with any shapes or text you may have drawn on the map with the Graphic Tools. You can do this by clicking on the Print Map icon in the bottom right of the Maps.

Who is involved?
Quite simply, everyone in Ireland has a role to play. This can be from something as simple as making sure you don’t pollute your local stream, or a local community working together to establish a Rivers Trust to enhance the rivers and lakes in their area, to a Government Department or Agency helping a Minister implement a new policy to help protect and enhance all our water bodies.
This website has been developed and is maintained by the Environmental Protection Agency, and is a collaboration between the Department of Housing, Planning and Local Government, the Environmental Protection Agency, and the Local Authority Waters Programme.
Local Authority Waters Programme
The Local Authority Waters Programme coordinates the efforts of local authorities and other public bodies in the implementation of the River Basin Management Plan, and supports local community and stakeholder involvement in managing our natural waters, for everyone’s benefit.

Environmental Protection Agency
The EPA is responsible for coordinating the monitoring, assessment and reporting on the status of our 4,842 water bodies, looking at trends and changes, determining which waterbodies are at risk and what could be causing this, and drafting environmental objectives for each.

Department of Housing, Local Government and Heritage
The Department is responsible for making sure that the right policies, regulations and resources are in place to implement the Water Framework Directive, and developing a River Basin Management Plan and Programme of Measures to protect and restore our waters.