Currently the EPA is evaluating the sources of pollution or…
Pollution Source Assessment in Sydney’s Drinking Water Catchments
Despite the obvious differences in climate and landscape, the experience of catchment management in Australia and Ireland has many similarities. This article describes the system used by Water New South Wales (WaterNSW) to assess the pollution characteristics of Sydney’s drinking water catchments.
In 2015 I drove with my family across the flat red expanse of western New South Wales, where lakes were often dry and rivers reduced to strings of stagnant pools. One year later the lakes were overflowing and the rivers overtopping their banks. Australia is, as Dorothea Mackellar famously wrote, a land of ‘droughts and flooding rains’. In comparison to Ireland, which on world terms is blessed in terms of water quantity, quality and reliability, Australian rivers vary dramatically month to month and year to year, from boom to bust and back again.
I work at WaterNSW, which manages the waterways, storages and catchments that supply Sydney’s drinking water and irrigation water across New South Wales. In order to deal with that variability, our storages and catchments are extremely large.
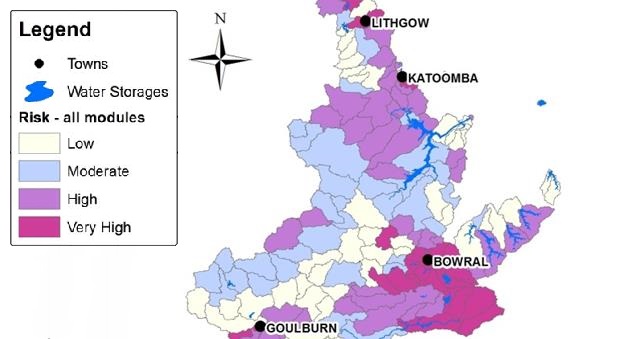
Lake Burragorang, the main reservoir in Sydney’s water supply system, is one of the largest domestic water supply storages in the world, and at over 16,000 km2, Sydney’s drinking water catchments are almost the size of Connaught. These catchments contain a massive diversity of land uses including grazing, dairies, horticulture, urban areas, industry, mining and native forests. The task of managing pollution sources in these catchments is therefore complex.

Of course, there are differences in climate and landscape between Ireland and Australia, but there are similarities in the challenges we face in managing our waterways, the key sources of pollution, and the actions available to address them. At WaterNSW we have legislative power to minimise the impact of new developments on water quality. We use more consultative methods when addressing existing pollution sources unless there has been a clear pollution incident or breach of licence conditions. Our approach is to fund a programme of catchment interventions in partnership with communities, including sewer upgrades, riparian fencing to exclude stock from streams, and dairy effluent management.
Our main aim is to minimise pollution at inflows to water storages, so all significant pollution sources are a high priority, even if their receiving streams remain at an acceptable standard in terms of overall environmental health. One challenge in this work is determining where within a large diverse catchment to spend limited resources – which geographic areas, which land uses, which properties.
Like the waterbody characterisation being carried out in Ireland under the Water Framework Directive, WaterNSW uses monitoring for a suite of chemical and biological contaminants to identify streams with elevated pollutant concentrations, and also apply pollution source tracing methods to pinpoint major sources. These activities are labour and cost intensive and therefore are mainly used to investigate specific critical issues and in compliance investigations.
A more efficient method was needed to prioritise the non-critical majority of pollution sources in Sydney’s drinking water catchments. To meet this need I have, for a number of years, developed and managed a pollution source risk assessment tool for WaterNSW named, creatively, the Pollution Source Assessment Tool (PSAT).
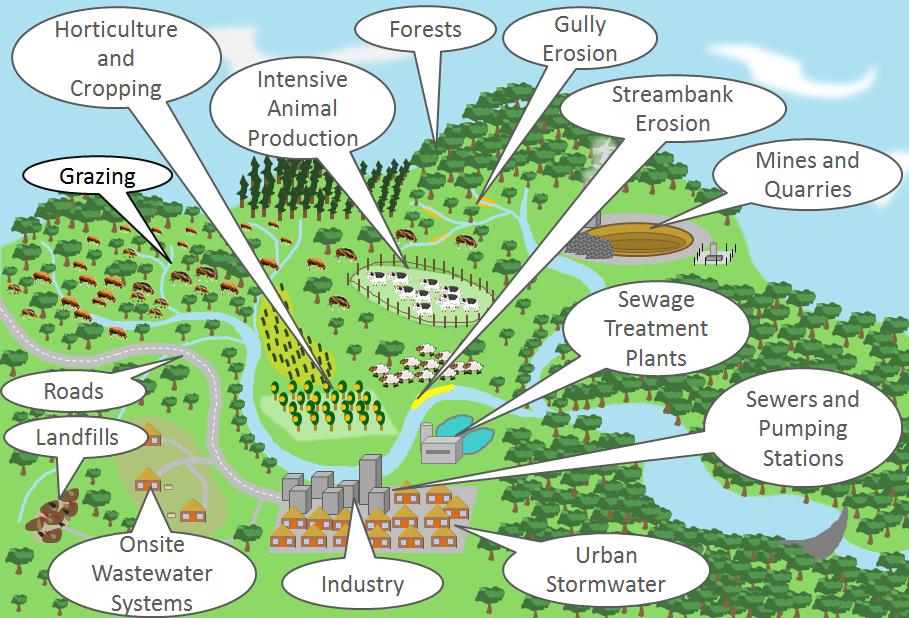
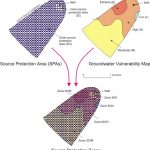
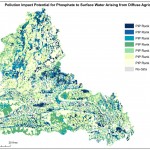
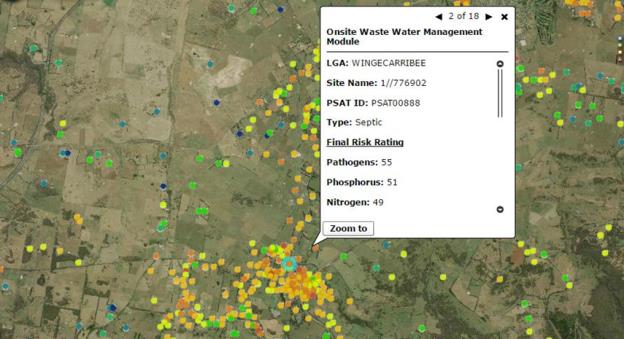
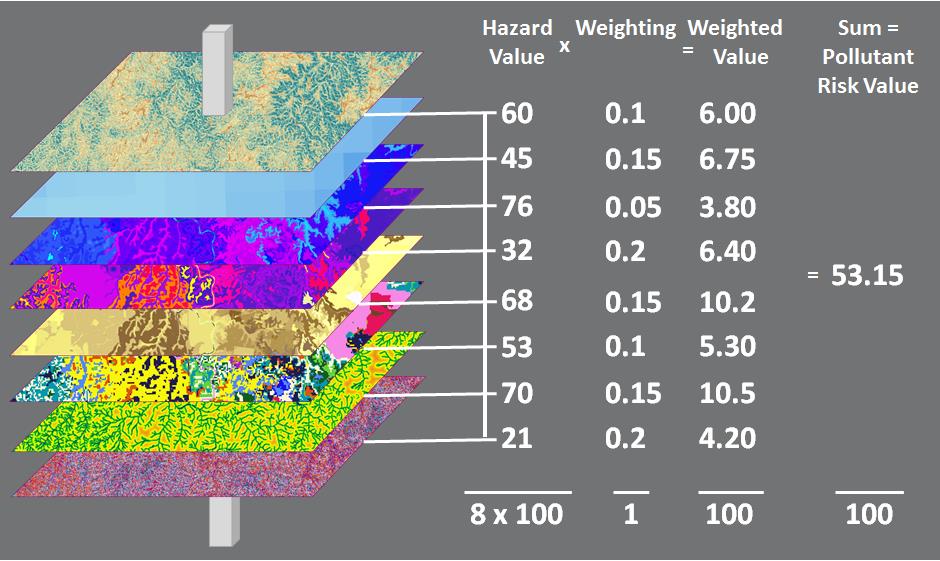
The Pollution Source Assessment Tool uses a geographic information systems (GIS) platform to assess the risk from all significant sources of pathogens, nitrogen, phosphorus and suspended solids in the drinking water catchments of Sydney. The pollution sources have been grouped into 14 different classes, and each class is addressed by a separate risk analysis, which we refer to as a ‘pollution source module’. Each module contains either point or diffuse sources.
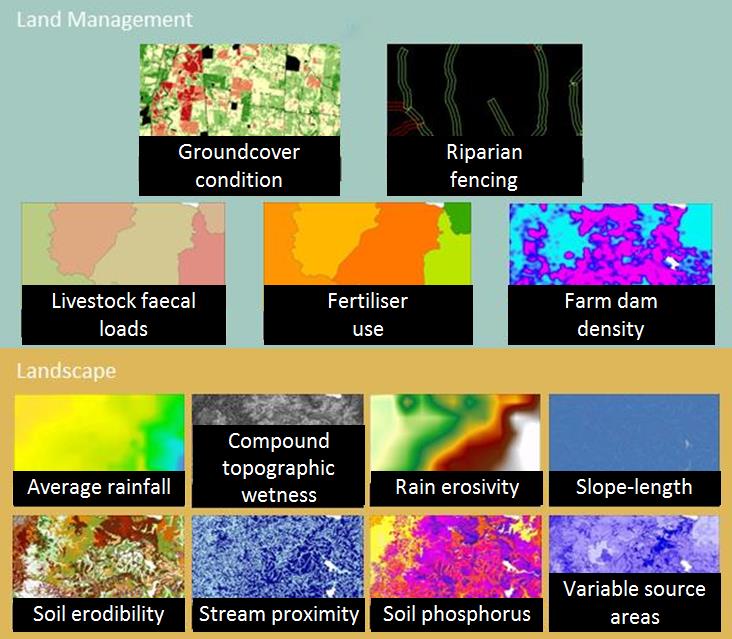
Teams of subject matter experts provide input into risk assessment criteria, inputs and weightings which are unique to each module. Spatial datasets and scientific data are collected or generated to inform these criteria. The heart of the assessment for each module is a simple multi-criteria analysis, where each criterion (input) is converted to a set of index values for every site (point sources) or 25m grid cell (diffuse sources). The index values are then weighted and summed to create overall risk ratings in point or grid cell form. These range between 0 and 100. These outputs provide useful information for prioritising within different pollution source modules, but not between them. For example they enable us to identify the critical source areas for grazing, but not the relative priority of grazing over horticulture.
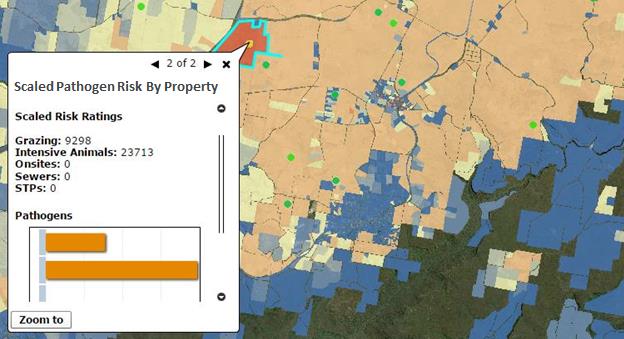
In 2015 we added a scaling process to the Pollution Source Assessment Tool to enable comparison between modules, and to improve our ability to communicate the benefit of proposed catchment interventions. This involves transforming the risk index values in each of those outputs into a common scale (estimated annual pollutant export rates) which is compatible across all pollution source modules.
To do this, we compiled a database of export rates for single land uses which were obtained from published pollutant runoff monitoring studies. This was used as a basis for estimating the minimum, maximum and median pollutant export rates for each module, which were then used to transform and scale each set of risk index values to create estimates of annual pollutant export rates.
Over such a large spatial scale, and with limited resources for small catchment monitoring, this scaling process is an estimate only, however it opens up an enormous range of uses and possibilities for use of the Pollution Source Assessment Tool in decision making and for validation of the results which were not possible in previous years.
The scaled outputs are stored in the form of a collection of spatial datasets: sites for point sources and grid cell values for diffuse sources. These can be summed for any combination of modules and by any set of spatial regions – subcatchments, local government areas, urban areas or larger grid cells. Scaled Pollution Source Assessment Tool outputs have been used in a variety of ways in catchment intervention planning: at full catchment scale to enable the allocation of funding between grazing, sewer and urban programmes, at subcatchment scale to communicate focus areas within the catchments, and also at the individual property level to identify potential locations of rural grant programmes.

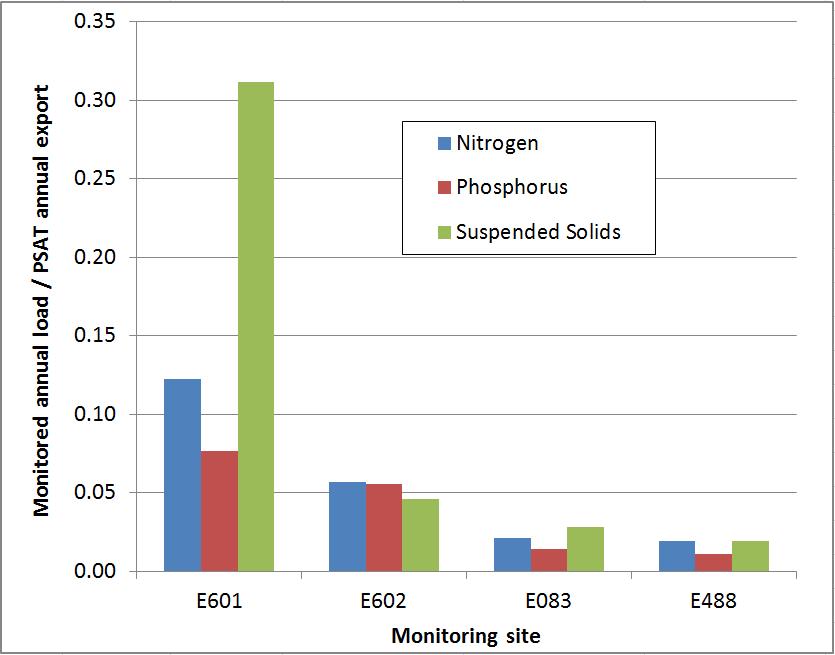
Another advantage of the scaling results is that we can use them to estimate annual export rates for each of the catchments of monitoring sites in our supply system. We can then compare these values with manual loads estimated from monitored water quality data. By calculating the ratio of monitored load to estimated export rates we can examine where the risk assessment and/or scaling process may be over or under estimating the risk from pollution sources or areas. In short, it allows us for the first time to use an independent dataset (long term average monitored load) to validate and refine the assessment.
As is the case in Ireland with the information available at www.catchments.ie, we have found that the simple act of gathering a comprehensive database of information about pollution sources has many benefits in catchment management in addition to the risk assessment itself.
The Pollution Source Assessment Tool has improved understanding, challenged assumptions, driven scientific research and guided thinking and decision making, giving value far beyond the simple prioritisation of catchment programmes.