
15 December 2020: The Environmental Protection Agency (EPA) has today…
New updates to EPA tools for targeting agricultural measures to protect water quality
The Environmental Protection Agency (EPA) published updated evidence to further support the targeting of agricultural measures to protect and improve water quality.
There are three updates to the evidence in the report:
- The scale of nitrogen load reductions needed in the catchments in the southeastern half of the country where nitrogen levels remain too high.
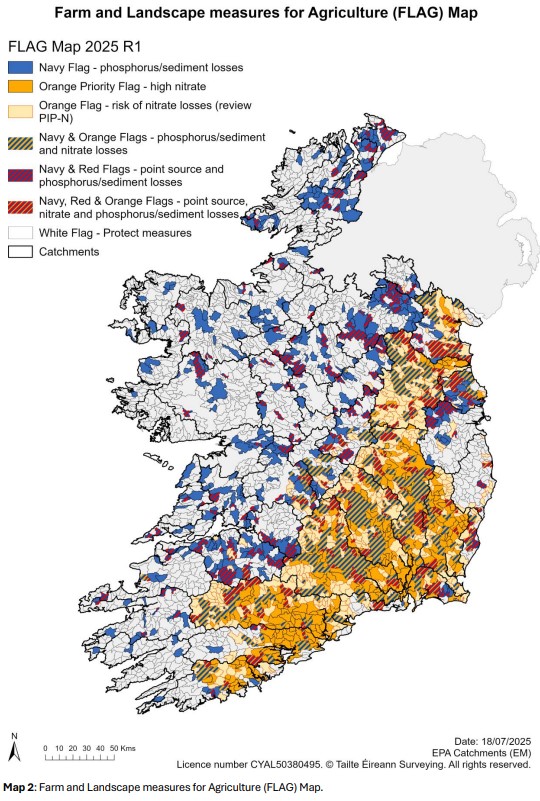
- A new edition of the Farm and Landscape measures for Agriculture (FLAG) map. This was previously called the Targeting Agricultural Measures map.
- An extension of the datasets of (a) catchment nitrogen concentrations and (b) catchment nitrogen load reductions needed, for the period 1990 to 2024. This provides a wider context for current levels.
These updates to the evidence have been informed by the most recently published EPA report on Nitrogen and Phosphorus Concentrations in Irish Waters 2024 which noted that although nitrogen levels reduced in 2024, they remain too high in the catchments in the southeastern half of the country. This report shows that some areas have achieved the required nitrogen reductions, and most catchments are now closer to their target than they were for the previous assessment which covered the period 2017-2019. However, the current results still fall short of the levels observed between 2008 and 2011, which remains the period when nitrogen levels were closest to meeting ecological targets over the past 35 years.
Ongoing and sustained action will be needed in the higher risk, freely draining, agricultural areas to further reduce nitrogen losses to waters before aquatic ecological health, and overall water quality will improve. The EPA map to help identify where these highest risk areas are, and the types of actions that are needed, has also been updated. This map is now called the Farm and Landscape measures for Agriculture (FLAG) map.
Farm and Landscape measures for Agriculture (FLAG) update 2025
To assist in targeting agricultural actions, the EPA has developed the FLAG map to help inform the agricultural sector about where, and what kinds of supplementary actions are needed to improve water quality in addition to the basic measures.
The FLAG map draws together multiple lines of evidence to highlight spatially where the agricultural sector is a pressure impacting on water quality, what the specific water quality issue is (whether nitrogen, phosphorus/sediment or ammonia), and therefore what kind of measures are needed (whether source control, pathway interception or farmyard management).
The 2025 FLAG map update incorporates chemistry monitoring data from 2022 to 2024 and includes minor revisions to the assessment of significant agricultural pressures and local authority investigations.
Read more:
Further information on local water quality and the updated FLAG map is also available here.