The EPA report Water Quality In Ireland 2013-2018 was originally…
Water Quality in Ireland – Pressures, Trends and Targeting Measures
Dr Jenny Deakin, Environmental Protection Agency, Richview, Clonskeagh, Co. Dublin
Summary
- Water quality is improving in some areas but continues to decline overall. The latest 3-yearly EPA report highlights that 52% of surface waters are at good or high ecological status, down from 54% in the last assessment.
- Every sector has a role to play, however, excess nutrients from agriculture remains the greatest challenge. Phosphorus loss occurs in local hotspot areas where soils are poorly draining; nitrogen loss occurs is an issue in the southeastern half of the country where the soils are freely draining.
- There is evidence that phosphorus concentrations are reducing in the areas where actions are being targeted, which is positive. Nitrogen concentrations have also reduced in recent years although they remain too high in the southeast.
- There are many actions underway but the scale and pace of implementation needs to be increased. EPA has developed tools to help target the right measure in the right place.
- Better data also needs to be collected on when and where actions are being implemented to provide better information on how progress can be accelerated.
Water Quality in Ireland
The most recent EPA report on water quality in Ireland (EPA, 2025a) highlights that 52% of rivers, lakes, estuaries and coastal waters are in a satisfactory ecological condition, which means in good or high ecological status. This assessment includes multiple water quality parameters, including for example, nutrients, chemicals, oxygen levels, aquatic insects, plants, algae and fish, which together give an integrated picture of the condition of our waters. The report found that overall water quality has declined since the previous assessment (EPA, 2022), when 54% of surface waters were satisfactory. While there have been improvements in water quality in some places, these have largely been offset by declines elsewhere. Transitional waters, including estuaries and coastal lagoons, are in the poorest condition of any waterbody type with 30% in a satisfactory condition, down from 36% in the last assessment.
The main water quality issue is excess nutrients from agriculture and waste water causing eutrophication or the overgrowth of algae and plants which disrupts aquatic ecosystems. The areas with elevated nutrients are shown in Figure 1. Damage to the physical condition of water habitats from activities such as land and river drainage, forestry and urban development, and toxic impacts from chemicals and other pesticides are also a concern.
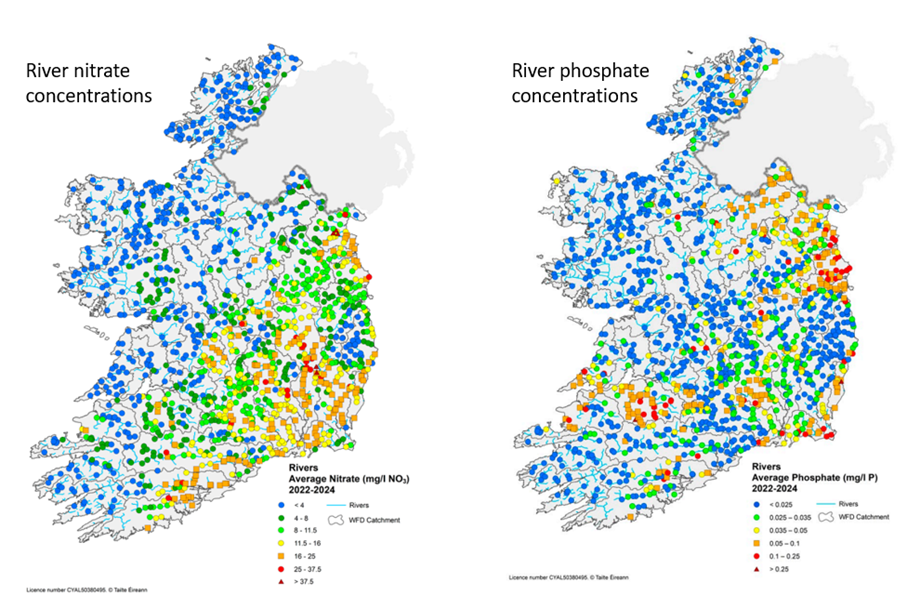
Agriculture is the most prevalent source of excess nutrients in the landscape, impacting approximately five times the number of waterbodies impacted by urban waste water (EPA, 2024a). The highest risk areas for phosphorus loss from agriculture are the poorly draining soils where rainfall runoff delivers nutrients and sediments to watercourses. In these areas, the soil type and the rainfall are more important driving drivers than the level of farming intensity. In contrast, excess nitrogen is an issue in the intensively farmed, freely draining soils in the southeast. In these areas, the greater the farming intensity, the greater the nitrogen loss.
Targeting Agricultural Measures
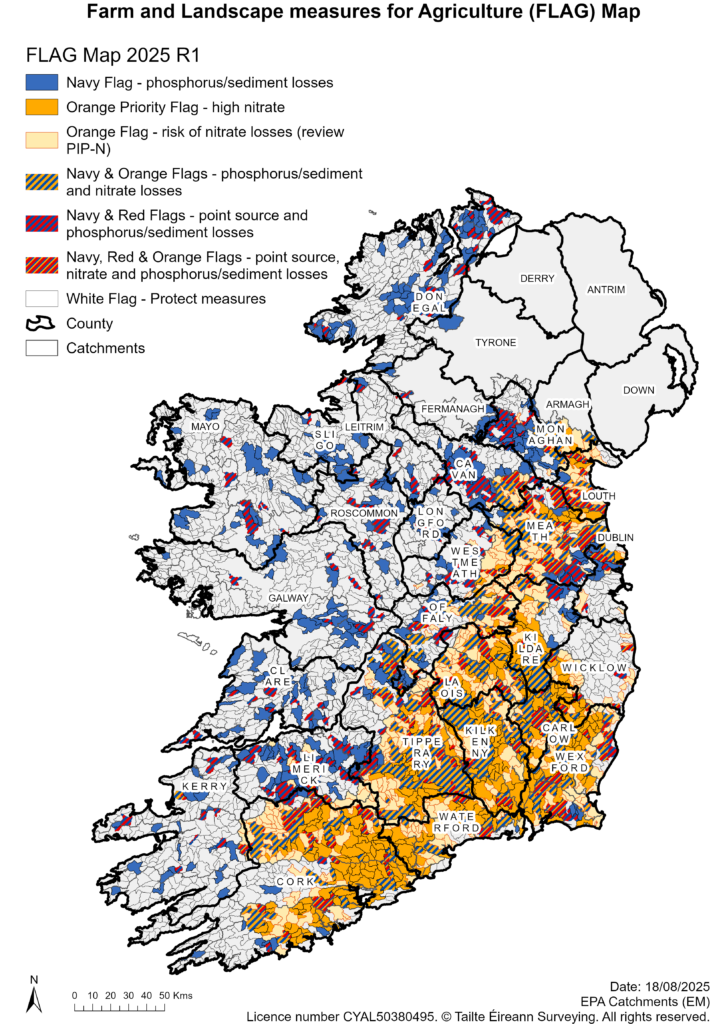
To support the on-going targeting of agricultural measures, the EPA has recently published an updated edition of the Farm and Landscape measures for Agriculture (FLAG) map (Figure 2), previously known as the Targeting Agricultural Measures map (EPA, 2025b). The map has been updated with the most recent information available for each water body. Orange areas on the map indicate areas to reduce nitrate losses, navy areas are for measures to reduce phosphorus/sediment losses, and red areas indicate that there is a potential farm point source issue. Within each water body, the relevant Pollution Impact Potential (PIP) map can be used to further target within the critical source areas for either nitrogen or phosphorus (EPA, 2021).
Progress in Priority Areas for Action
A key measure under the national River Basin Management Plan 2018-2021, and the Water Action Plan 2024, was the establishment of Priority Areas for Action (PAAs), where public sector bodies and stakeholders are working together to implement targeted actions to restore water quality. Where agriculture is a significant pressure, the Local Authority Waters Programme (LAWPRO) provides local science and evidence to the Agricultural Sustainability Support and Advisory Programme (ASSAP), who in turn give free advice and support to farmers to identify and implement the right measure in the right place.
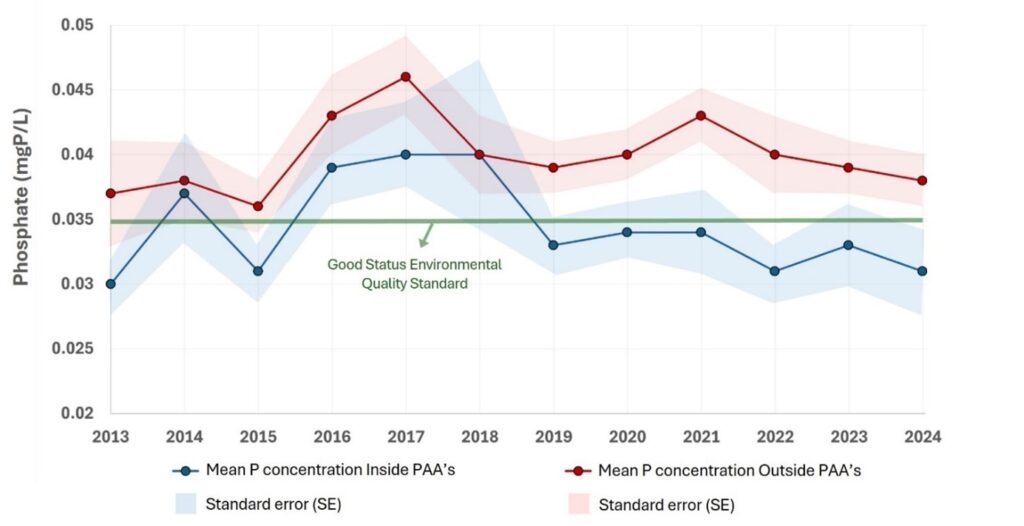
The latest EPA water quality report assessed whether there were greater levels of water quality improvements inside PAAs compared with other areas elsewhere. The evidence shows that in the PAAs, improvements have been made in ecological status in 21% of waterbodies, but these are being largely offset by waterbodies that have declined. There is no significant difference in changes in ecological status inside PAAs compared to elsewhere. However, there is evidence that there is an improvement in phosphorus concentrations in these areas (Figure 3). While phosphate levels were typically lower inside PAAs than outside before the establishment of LAWPRO and ASSAP in 2018, the gap has since widened with concentrations on average 22% lower inside PAAs (2019-2024). It is noteworthy that from 2019 onwards, mean phosphate levels inside PAAs were consistently below the good status environmental quality standard of 0.035 mg P/L, which was an improvement compared to the period leading up to their establishment. It is hoped that in time, following a period of recovery, these phosphorus reductions will lead to improvements in ecological status.
Conclusion
Overall, water quality in Ireland is continuing to decline, despite improvements in some areas. All sectors have a role to play. Excess nitrogen and phosphorus losses from agriculture remain a key contributing factor. While there are many actions being undertaken across the sector to improve water quality, the scale and pace of implementation needs to be increased. The EPA has updated our tools and maps to help target the right measures in the place. The evidence shows that in the Priority Areas for Action, where actions are being targeted, there are greater levels of improvement in phosphorus concentrations than elsewhere. This highlights the progress that can be made when actions are targeted. It is essential that better information is collected by all stakeholders, on when and where the actions are being implemented on the ground, to provide better information on how the progress can be accelerated.
Acknowledgements
EPA colleagues who deliver the water monitoring programmes and the assessments of pressures impacting on waters. Colleagues from Local Authorities, Inland Fisheries Ireland, Marine Institute, Waterways Ireland and the Local Authorities Waters Programme who assist in the monitoring and assessment of waters and pressures.
Bibliography
EPA (2021) Next Generation Pollution Impact Potential maps launched. Wexford, Ireland. https://www.catchments.ie/next-generation-pollution-impact-potential-maps-launched/; Accessed 14/10/25
EPA (2022) Water Quality in Ireland 2016-2021. Wexford, Ireland. https://www.epa.ie/publications/monitoring–assessment/freshwater–marine/water-quality-in-ireland-2016–2021-.php; Accessed 14/10/25
EPA (2024a) Update on Pressures Impacting on Water Quality. Wexford, Ireland. https://www.epa.ie/publications/monitoring–assessment/freshwater–marine/update-on-pressures-impacting-on-water-quality.php; accessed 14/10/25.
EPA (2024b) Catchment assessments of water quality and pressures for each of 46 catchments. Wexford, Ireland. https://www.catchments.ie/wfd-cycle-3-catchment-assessments-published-by-the-epa/; accessed 14/10/25.
EPA (2025a) Water Quality in Ireland 2019-2024. Wexford, Ireland. https://www.epa.ie/publications/monitoring–assessment/freshwater–marine/water-quality-in-ireland-2019-2024.php; accessed 14/10/25.
EPA (2025b) Evidence Based Targeting of Agricultural Measures to Reduce Nitrogen in Catchments to Achieve Water Quality Objectives. Wexford, Ireland. Nitrate_Reductions_and_FLAG_Map_July2025_F01.pdf; accessed 14/10/25.
EPA (2025c) Water Quality Monitoring Report on Nitrogen and Phosphorus concentrations in Irish Waters 2024. Wexford, Ireland. https://www.epa.ie/publications/monitoring–assessment/freshwater–marine/water-quality-monitoring-report-on-nitrogen-and-phosphorus-concentrations-in-irish-waters-2024.php; accessed 14/10/25.
Read More
Find out how the EPA assesses water quality. EPA Factsheet: how we assess water quality – Catchments.ie – Catchments.ie
Significant Pressures: Agriculture – Catchments.ie – Catchments.ie
Priority Areas for Action: Taking Action – Catchments.ie – Catchments.ie
Farm and Landscape measures for Agriculture mapping tool: https://gis.epa.ie/EPAMaps/agriculture