On this episode of the Signpost Series which took place…
Farm and Landscape measures for Agriculture (FLAG) Map – Updated 2025
The EPA’s Farm and Landscape Measures for Agriculture (FLAG) map is a vital resource designed to help improve water quality by providing farmers and landholders with information that will help them understand their local water quality and where action needs to be taken. The 2025 update builds on previous versions (formally the Targeting Agricultural Measures map) and integrates the latest monitoring data and scientific assessments.
Farm and Landscape measures for Agriculture Mapping Tool
The FLAG mapping tool has information under these menu headings:
- Status & Monitoring – View current water quality status and monitoring station locations
- Targeting Agricultural Measures – Explore two key layers:
- Farm and Landscape Measures for Agriculture – shows pollutants in waterbodies impacted by agriculture.
- River Agricultural Pressures – highlights where agriculture is a significant pressure on water quality.
- Nitrogen / Freely Draining Soils – Identify areas at risk of nitrogen loss due to well-drained soils
- Phosphorus / Heavy Soils – Locate areas prone to phosphorus and sediment runoff from heavy soils
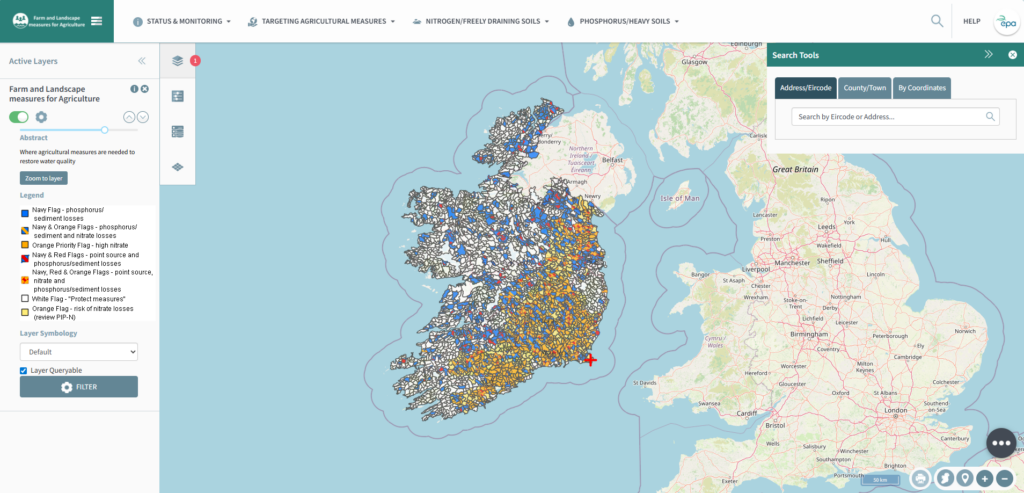
Targeting Agricultural Measures
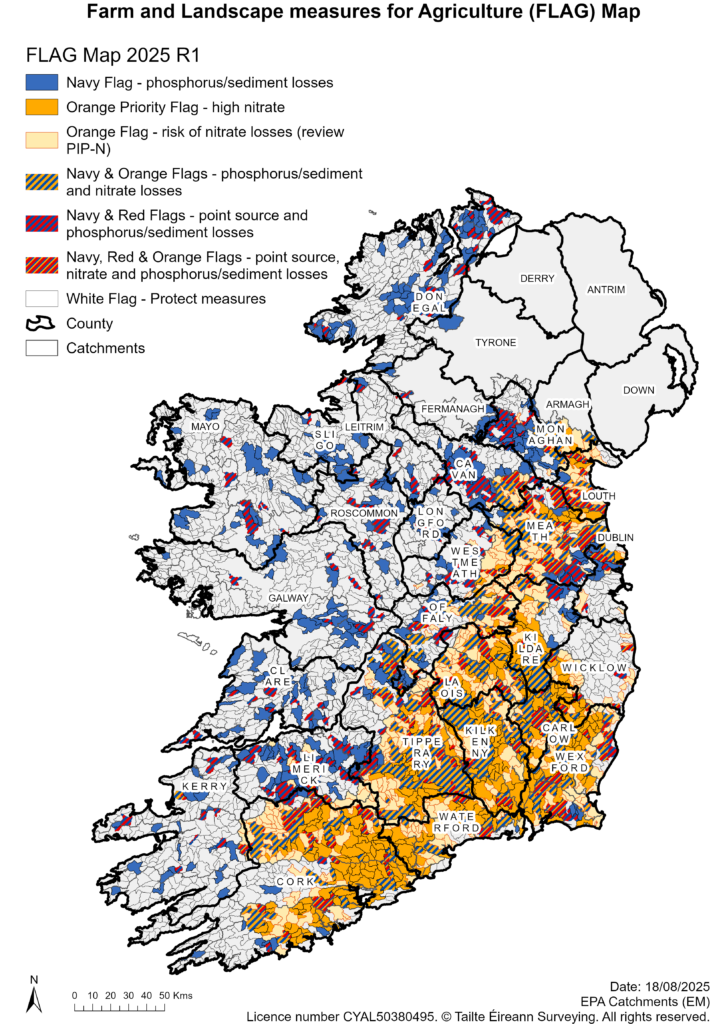
The Farm and Landscape measures for Agriculture layer (found under the Targeting Agricultural Measures tab) shows what the issue/pollutant is in waterbodies that are impacted by agriculture.
Where agricultural measures are needed to improve water quality, one or more colour flags indicate the types of water quality issues in that area. This helps farmers in these areas to focus on actions that are likely to have the best water quality results.
The map has white for ‘Protect’ in areas where there are no agricultural significant pressures on water quality; in these areas it is still important that everyone takes action to continue to protect water quality.
What’s New in the 2025 Update
- Incorporates 2022–2024 chemistry monitoring data
- Updated methodology for identifying ammonium/farmyard pollution (threshold increased to 0.065 mg/l)
- Slight increase in flagged waterbodies due to improved data and local authority input
- Areas with phosphorus/sediment issues remain consistent with previous assessments
Read more: New updates to EPA tools for targeting agricultural measures to protect water quality
FLAG Map leaflet
A downloadable flyer is available to help farmers and advisors understand how to use the FLAG map in practice. It includes:
- A visual guide to help you navigate the FLAG mapping tool
- Clear explanations of the different map layers and what they show
- Links to support schemes and advisory services to help take action
Take Action
The video below from the Irish Farmers Association and Teagasc shows actions farmers can take to improve water quality on their farm.
- Apply manure, slurry and fertiliser correctly.
- Introduce an extended buffer zone.
- Locate water troughs away from waterways.
- Implement a nutrient management plan.
- Introduce mixed species & clover to your grass swards.
You can learn more here: SmartFarming | Sources and Solutions – Link Between Our Soils & Water Quality
A Handbook of Source Protection and Mitigation Actions for Farming
The National Federation of Group Water Schemes has also produced this very useful and detailed guide to on-farm actions to improve water quality: NFGWS_handbook_farming-mitigation-actionsFebruary2021.