'Hydrometrics’ is the measurement of water levels and flow -…
Catchment characterisation: telling stories with data
Eva Mockler from the EPA Catchments Unit outlines some of the data and models used by Catchment Scientists to assess Ireland’s water bodies, and how this knowledge can help us get the right measure in the right place.
Characterisation of our catchments means that we understand how catchments work from the mountains to the sea. This includes assessing the impacts and risks of human activities on the water environment to help prioritise high risk areas for management strategies, including targeted programmes of measures, and monitoring. The goal is to get the right measure in the right place.
However, real world data rarely gives us a single, clear story. This is why Catchment Scientists need to rely on expertise and judgment to reach conclusions based on all the evidence available. Using data, they can start with the big picture and provide context so we will be less likely to jump to mistaken conclusions. Most importantly, they can highlight the insights in the data which may be hidden below the surface and use this understanding to tell the story of the catchment.
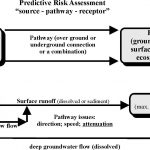
Diffuse sources of pollution are a major challenge and understanding the source-pathway-receptor framework, and the critical source areas for these pollutants, is important for targeting measures.
Data analysis and models have played an important role by adding value to available national datasets, mapping and expert assessments. Catchment management can be supported by a variety of modelling tools to reduce the resources required to analyse substantial amounts of information.
Data and Models to support Catchment Science and Management
Numerical modelling complements the EPA’s environmental monitoring and assessment programme by synthesising available information to test hypotheses and uncover new relationships between sources, pressures, and impacts on environmental systems.
In recent years, the EPA has increased the use of modelling to support the assessment of inland and marine waters and the development of the River Basin Management Plan. For example, numerical modelling has been used in the EPA Catchments Unit to enhance scientific assessment methodologies, thereby enabling our team to target key pressures and highest-risk geographical areas.
Water-related modelling has been commissioned through the Water pillar of the EPA’s Research Programme which funds research projects and fellowships to undertake a variety of environmental modelling studies on topics including floods, droughts, and water pollution. For example, the EPA Research Programme has invested significantly in catchment characterisation and modelling tools, including the Catchment Characterisation Tool and the Source Load Apportionment Model. These include tools to support the Water Framework Directive risk characterisation process and to undertake scenario analyses that assist in identification of appropriate programmes of measures.
Modelling for Catchment Characterisation
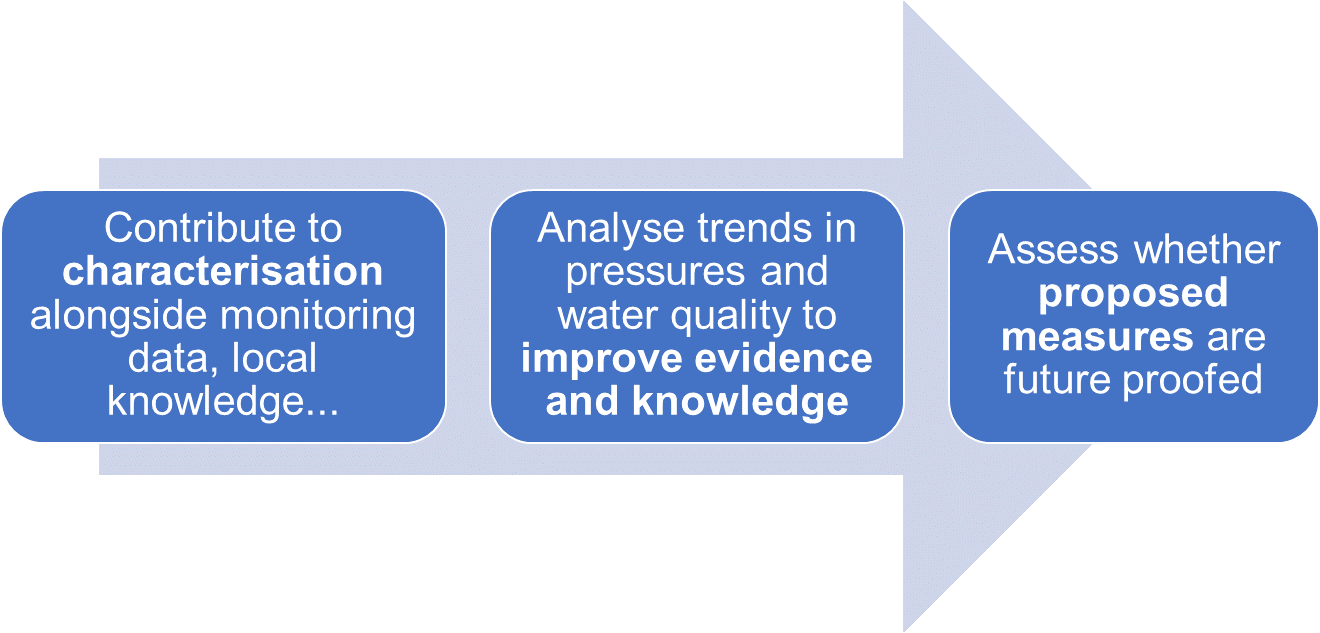
Figure 1. Data and models supporting catchment science and management.
The characterisation of water bodies for the second cycle of the Water Framework Directive included evaluation of physical, hydrochemical and ecological characteristics, and a risk assessment of pressures, pathways and impacts. These assessments used results from water quality models to significantly enhance understanding, thereby enabling staff to target key pressures and highest-risk geographical areas. The following are the main models used to support the recent characterisation assessments:
- The Pollution Impact Potential (PIP) maps help locate the Critical Source Areas (CSAs) within catchments for nitrogen (PIP-N) and phosphorus (PIP-P). They were initially developed by the EPA Pathways Project and further developed by the EPA Catchment Tools and Diffuse Tools projects. These maps indicate the main transport pathways of diffuse nutrients from agriculture land to surface waters. They incorporate soils, subsoils and bedrock maps along with average rainfall and estimates of stocking densities. They are suitable to give indications of the nutrient hot spots in a sub-catchment but are not reliable or meant for use at field scale.
- A model to predict the impact of Septic Tank Systems water bodies was developed to support the characterisation of water bodies in rural settings. The Source Apportionment of Nutrients in Irish Catchments for On-Site Effluent (SANICOSE) model estimates the nutrient emissions to water from for each septic tank location. Annual nitrogen and phosphorus loads were aggregated for each water body or sub-catchment and these results were incorporated into other models and assessments.
- The Source Load Apportionment Model (SLAM) results supported the assessment of nutrient load information in a logical, structured, consistent and comparative way across the country and has therefore enabled robust and practical use of the information. This geospatial modelling framework significantly upgraded the available methods and data using new GIS models to identify the sources of nitrogen and phosphorus to identify potential pressures causing eutrophication. There are nine sector models including 3 types of point sources and 6 diffuse sources. The wastewater calculations use data from annual environmental reports for over 1,000 wastewater treatment plants, and the agricultural calculations use Department of Agriculture data, in combination with export coefficients linked to catchment characteristics.
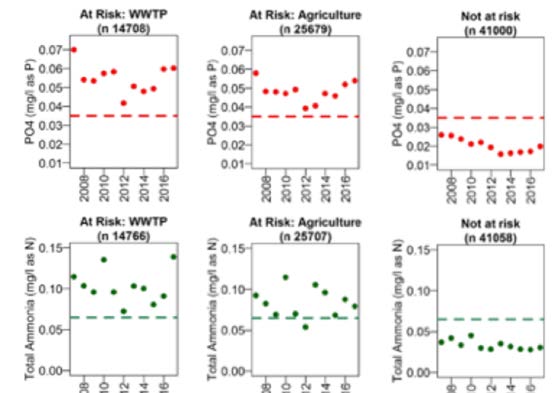
Figure 2: Combining Significant Pressure
information with the national monitoring data
can give insights into trends – see the Pressure
Narratives on page 28. These graphs show average
annual ortho-Phosphate and Ammonia
concentrations in rivers from 2007 to 2017 for WFD
monitored river water bodies with urban waste
water (WWTP) and agriculture as a significant
pressure and all river water bodies Not At Risk.
Modelling the future
Catchments are constantly evolving as human activities and climate are changing. In addition to assessment, numerical modelling can provide information about the effectiveness of measures and the possible response of water bodies to future actions:
- Models of estuaries and coastal waters have been used to identify the magnitude of nutrient reductions required to achieve Good status, thereby supporting the selection of appropriate mitigation measures.
- Catchment-scale scenario analysis is underway in the East of Ireland to assess the impact of projected changes in land cover and land use change, population increases and wastewater treatment improvements on water quality.
- The Hydrological modelling capabilities of the EPA are being greatly improved by the Hydrometrics and Groundwater Unit. Low flow and e-flow assessments will be based on the Qube model, which will replace Hydrotool in the coming months. This will enable a cumulative assessment of abstractions and discharges and support resilience management for future climate
extremes. You can read more about the EPA Hydrometrics Programme on page 39 of the Winter 2018 Catchments Newsletter.
Sharing data, telling stories
When telling stories with data, the aim is to really explain the data so that complex science can be communicated with clarity, precision and efficiency. By analysing the evidence in a balanced and objective manner, the catchment story should tell itself. Combining Significant Pressure information with the national monitoring data can give insights into trends – see figure 2, and the Pressure Narratives on page 28 of the Winter 2018 Catchments Newsletter.
Some of these stories may be complex and are still evolving as our understanding improves and as new evidence is uncovered. Catchments.ie will be used to publish the latest information on the stories of our catchments, including monitoring data and graphs, statistics on water body status, WFD risk and Significant Pressures, maps, articles and more.
Eva Mockler, EPA Catchments Unit
Learn more:
The impact of nutrient reduction measures on the health of Irish estuarine systems